Microsoft Power BI for Data Science and Data Analytics
"softddl.org"
2-10-2020, 19:38
-
Share on social networks:
-
Download for free: Microsoft
-

MP4 | Video: h264, 1280x720 | Audio: AAC, 44.1 KHz, 2 Ch
Genre: eLearning | Language: English | Duration: 79 lectures (4h 49m) | Size: 1.92 GB
Mastering Microsoft Power BI on designing and developing repots for data science and data analytics
 MP4 | Video: h264, 1280x720 | Audio: AAC, 44.1 KHz, 2 Ch
Genre: eLearning | Language: English | Duration: 79 lectures (4h 49m) | Size: 1.92 GB
Mastering Microsoft Power BI on designing and developing repots for data science and data analytics
What you'll learn:
Administering Microsoft Power BI Services
Creating data visualizations with various Power BI charts
Publishing Power BI reports to Power BI Service (powerbi-com)
Working with various data sources: local files, Power BI datasets, database server, Azure databases
Customizing Power BI report format
Power BI Report Interactivity
Data Analysis Expression (DAX) and data transformation
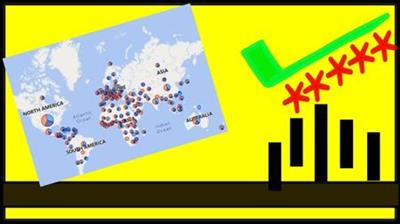
Building geographic reports with Bing Map, Filled Map, ArcGIS, and Shape Map
Power BI reports based on Python and R scripts
Power BI Artificial Intelligence reports (KPI, Key Influencer, Decomposition Tree)
Power BI reports with Azure Analysis Services
Power BI on-premises Data Gateway
Building Power BI reports with local database via Power BI Data Gateway
Create Power BI reports for mobile devices with Power BI Mobile
Requirements
Computer with Windows OS
Internet Access
No prior knowledge for designing reports
Description
Microsoft Power BI is a one of business analytics service to visualize data and make interactive visualizations. This Bootcamp has a goal to help you how to build Power BI reports with various charts and various data sources.
You will learn how to build basic visualizations with various Power BI charts. Working on various data sources included Azure Database. Customizing Power BI report format and making report interactivity with Data Analysis Expression (DAX). You can visualize your data in geographic reports and also make Power BI report based on Python and R scripts. Visualizing your Azure Analysis Services in Power BI reports. You can extend your data sources with local database by applying Power BI Data Gateway. Last, we build Power BI reports for mobile devices with Power BI Mobile.
You don't have any prior experience in Power BI to follow this Bootcamp.
**Update 25 June 2020**
I added new materials about Power BI Mobile
Who this course is for
Report Designers
Business and System Analyst
Developers
IT Administrator
Data Scientist
Data Engineers
Homepage
https://www.udemy.com/course/pbidatascience/
Buy Premium From My Links To Get Resumable Support,Max Speed & Support Me
 https://uploadgig.com/file/download/7000788683697Eca/19su3.Microsoft.Power.BI.for.Data.Science.and.Data.Analytics.part1.rar
https://uploadgig.com/file/download/Ef996dbb158b13cB/19su3.Microsoft.Power.BI.for.Data.Science.and.Data.Analytics.part2.rar
 https://rapidgator.net/file/6322047c9d0a26910017dcb0f3da7e36/19su3.Microsoft.Power.BI.for.Data.Science.and.Data.Analytics.part1.rar.html
https://rapidgator.net/file/f2a83364439d218d2cd08e0934a7db56/19su3.Microsoft.Power.BI.for.Data.Science.and.Data.Analytics.part2.rar.html
 http://nitroflare.com/view/08745149E35FB01/19su3.Microsoft.Power.BI.for.Data.Science.and.Data.Analytics.part1.rar
http://nitroflare.com/view/0626B1233C0771A/19su3.Microsoft.Power.BI.for.Data.Science.and.Data.Analytics.part2.rar
The minimum comment length is 50 characters. comments are moderated


